RGB-D Tracking: Depth Scaling Kernelised Correlation Filters DS-KCF

Massimo Camplani, Sion Hannuna,  Majid Mirmehdi, Dima Damen, Adeline Paiement, Lili Tao, Tilo BurghardtReal-time RGB-D Tracking with Depth Scaling Kernelised Correlation Filters and Occlusion HandlingBritish Machine Vision Conference, September 2015.

S. Hannuna, M. Camplani, J. Hall, M. Mirmehdi, D. Damen, T. Burghardt, A. Paiement, L. Tao, DS-KCF: A real-time tracker for RGB-D dataJournal of Real-Time Image Processing (2016). Open Access Publication can be downloaded here DOI: 10.1007/s11554-016-0654-3

The recent surge in popularity of real-time RGB-D sensors has encouraged research into combining colour and depth data for tracking. The results from a few, recent works in RGB-D tracking have demonstrated that state-of-the-art RGB tracking algorithms can be outperformed by approaches that fuse colour and depth, for example [1, 3, 4, 5]. In this paper, we propose a real-time RGB-D tracker which we refer to as the Depth Scaling Kernelised Correlations Filters (DS-KCF). It is based on, and improves upon, the RGB Kernelised Correlation Filters tracker (KCF) from [2]. In this paper, we propose a real-time RGB-D tracker which we refer to as the Depth Scaling Kernelised Correlations Filters (DS-KCF). It is based on, and improves upon, the RGB Kernelised Correlation Filters tracker (KCF) from [2]. KCF is based on the use of the ‘kernel trick’ to extend correlation filters for very fast RGB tracking. The KCF tracker has important characteristics, in particular its ability to combine high accuracy and processing speed as demonstrated in [2, 6].

The proposed RGB-D single object tracker is able to exploit depth information to handle scale changes, occlusions, and shape changes. Despite the computational demands of the extra functionalities, we still achieve real-time performance rates of 35-43 fps in Matlab, and 187 fps in our C++ implementation. Our proposed method includes fast depth-based target object segmentation that enables, (i) efficient scale change handling within the KCF core functionality in the Fourier domain, (ii) the detection of occlusions by temporal analysis of the target’s depth distribution, and (iii) the estimation of a target’s change of shape through the temporal evolution of its segmented silhouette allows. Both the Matlab and C++ versions of our software are available in the public domain.

DSKCF

This paper contains an extension of the DS-KCF proposed in [7]. In this section we provide a detailed description of the core modules comprising DS-KCF, which extend the KCF tracker in a number of different ways. We integrate an efficient combination of colour and depth features in the KCF-tracking scheme. We provide a change of scale module, based on depth distribution analysis, that allows to efficiently modify the tracker’s model in the Fourier domain. Different to other works that deal with change of scale within the KCF framework, such as [2,3], our approach estimates the change of scale with minimal impact on real-time performance. We also introduce an occlusion handling module that is able to identify sudden changes in the target region’s depth histogram and to recover lost tracks. Finally, a change of shape module, based on the temporal evolution of the segmented target’s silhouette, is integrated into the framework. To improve the tracking performance during occlusions, we have added a simple Kalman filter motion model.

A detailed overview of the modules of the proposed tracker is shown in the figure below. Initially, depth data in the target region is segmented to extract relevant features for the target’s depth distribution. Then, modelled as a Gaussian distribution, changes in scale guide the update in the target’s model. At the same time, region depth distribution is deployed to enable the detection of possible occlusions. During an occlusion, the model is not updated and the occluding object is tracked to guide the target search space. Kalman filtering is used to predict the position of the target and the occluding object in order to improve the occlusion recovery strategy. Further, segmentation masks are accumulated over time and used to detect significant changes of shape of the object.


schematrackerjournalv2
Block diagram of the proposed DS-KCF tracker

Results on Princeton Dataset [4] (validation set)

We compare tracking performance by reporting the precision value for an error threshold equal to 20 pixels (P20), the area under the curve (AUC) of success plot measure, and the number of processed frames per second (fps). Table 1 shows that the proposed DS-KCF tracker outperforms the baseline KCF leading to better results both in terms of AUC and P20 measures. DS-KCF also outperforms the other two RGB-D trackers tested, Prin-Track [4] and OAPF [3]. Furthermore, the average processing rate in the Prin-Track (RGB-D) is 0.14fps and 0.9fps for the OAPF tracker in striking contrast to 40fps for DS-KCF. Example results of the trackers are shown in the videos below. Results on the test set of the Princeton dataset can be found here

 bigtable

 Trackers’ performance on Princeton Evaluation Dataset [4]

Overall, only two approaches, OAPF [5] and RGBDOcc+OF [4], obtain a higher Avg. Rank (by approximately 0.6% more) and a higher average AUC value (by approximately 1.4% more). However, as reported by their authors, these approaches achieve a very low processing rate of less than 1 fps. Our proposed method has an average processing rate ranging from 35 to 43 fps for its Matlab implementation and 187 fps for its C++ version.

Updated results can be found in the dataset webpage

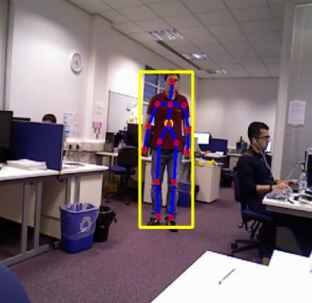
Qualitative examples of the DS-KCF’s performance on Princeton Dataset [4] and BoBoT-D dataset [1] are shown below.

GITHUB DSKCF code

The C++ and MATLAB version of the code are also available in GITHUB here. Code of the DSKCF tracker may be used on the condition of citing our paper “DS-KCF: A real-time tracker for RGB-D data. Journal of Real-Time Image Processing″ and the SPHERE project. The code is released under BSD license.

DSKCF C++ code (no shape Module)

The C++ code of the new version of the DSKCF tracker may be used on the condition of citing our paper “DS-KCF: A real-time tracker for RGB-D data. Journal of Real-Time Image Processing″ and the SPHERE project. The code is released under BSD license and it can be downloaded here. Please not this does not contain the shape-handling module

DSKCF Matlab code (with shape Module)

The Matlab code of the new version of the DSKCF tracker may be used on the condition of citing our paper “DS-KCF: A real-time tracker for RGB-D data. Journal of Real-Time Image Processing″ and the SPHERE project. The code is released under BSD license and it can be downloaded here

DSKCF Matlab code (BMVC VERSION)

The Matlab code of the DSKCF tracker can be downloaded here. It may be used on the condition of citing our paper “Real-time RGB-D Tracking with Depth Scaling Kernelised Correlation Filters and Occlusion Handling, BMVC2015″ and the SPHERE project. The code is released under BSD license and it can be downloaded here

RotTrack DATASET

The datset can be used for research purposes on the condition of citing our paper “DS-KCF: A real-time tracker for RGB-D data. Journal of Real-Time Image Processing″ and the SPHERE project. The dataset can be downloaded from the University of Bristol official repository data.bris

References

[1] G. García, D. Klein, J. Stückler, S. Frintrop, and A. Cremers. Adaptive multi-cue 3D tracking of arbitrary objects. In Pattern Recognition, pages 357–366. 2012.
[2] J. F. Henriques, R. Caseiro, P. Martins, and J. Batista. High-speed tracking with kernelized correlation filters. Pattern Analysis and Machine Intelligence, IEEE Transactions on, 2015.
[3] T. Meshgi, S. Maeda, S. Oba, H. Skibbe, Y. Li, and S. Ishii. Occlusion aware particle filter tracker to handle complex and persistent occlusions. Computer Vision and Image Understanding, 2015 to appear.
[4] S. Song and J. Xiao. Tracking revisited using RGBD camera: Unified benchmark and baselines. In Computer Vision (ICCV), 2013 IEEE International Conference on, pages 233–240, 2013.
[5] Q. Wang, J. Fang, and Y. Yuan. Multi-cue based tracking. Neurocomputing, 131(0):227 – 236, 2014.
[6] Y. Wu, J. Lim, and M. Yang. Online Object Tracking: A Benchmark. In Computer Vision and Pattern Recognition (CVPR), 2013 IEEE Conference on, pages 2411–2418, 2013.
[7] Massimo Camplani, Sion Hannuna, Majid Mirmehdi, Dima Damen, Adeline Paiement, Lili Tao, Tilo Burghardt. Real-time RGB-D Tracking with Depth Scaling Kernelised Correlation Filters and Occlusion Handling.
[8] Danelljan M, Haager G, Shahbaz Khan F, Felsberg M (2014) Accurate Scale Estimation for Robust Visual Tracking. In: BMVC 2014
[9] Li Y, Zhu J (2015) A scale adaptive kernel correlation Filter tracker with feature integration. In: ECCV Workshops, vol 8926, pp 254-265.

Online quality assessment of human movements from Kinect skeleton data

The objective of this project is to evaluate the quality of human movements from visual information which has use in a broad range of applications, from diagnosis and rehabilitation to movement optimisation in sports science. Observed movements are compared with a model of normal movement and the amount of deviation from normality is quantified automatically.

Description of the proposed method

The figure below illustrates the pipeline of our proposed method.


overview
Figure 1: Pipeline of the proposed method


Skeleton extraction

Skeletondepth_325
Figure 2: Example of skeleton extracted from a depth map

We use a Kinect camera, that measures distances and provides a depth map of the scene (see Fig. 2) instead of the classic RGB image. A skeleton tracker [1] can use this depth map to fit a skeleton on the person being filmed. We then normalise the skeleton to compensate for people having various heights. This normalised skeleton is the basis of our movement analysis technique.

Robust dimensionality reduction

A skeleton contains 15 joints, forming a vector of 45 coordinates. Such vector has a quite high dimensionality but also redundant information. We use a manifold learning method, Diffusion Maps [2], to reduce the dimensionality and extract the significant information from this skeleton.

Skeletons extracted from depth maps tend to suffer from a high amount of noise and outliers. Therefore, we modify the original Diffusion Maps [2] to add the extension that Gerber et al. [3] proposed for dealing with outliers in Laplacian Eigenmaps that are another type of manifold.

Our manifold provides us with a new representation mathbf{Y}[\latex] of the pose, derived from the normalised skeleton, with a much lower dimensionality (typically 3 dimensions instead of the initial 45) and significantly less noise and outliers. We use this new pose feature mathbf{Y}[\latex] to assess the quality of the movement.

Assessment against a statistical model of normal movement

We build two statistical models from our new pose feature, which describe respectively normal poses and normal dynamics. These models are represented by probability density functions (pdf) which are learnt, using Parzen window estimators, from training sequences that contain only normal instances of the movement.

The pose model is in the form of the pdf \(f_{Y}\left(y\right)\) of a random variable \(Y\) that takes as value \(y=\mathbf{Y}\) our pose feature vector \(\mathbf{Y}\). The quality of a new pose \(y_t\) at frame \(t\) is then assessed as the log-likelihood of being described by the pose model, i.e. $$\mbox{llh}_{\mbox{pose}}= \log f_{Y}\left(y_t\right) \; .$$

The dynamics model is represented as the pdf \(f_{Y_t}\left(y_t|y_1,\ldots,y_{t-1}\right)\) which describes the likelihood of a pose \(y_t\) at a new frame \(t\) given the poses at the previous frames. In order to compute it, we introduce \(X_t\) with value \(x_t \in \left[0,1\right]\), which is the stage of the (periodic or non-periodic) movement at frame \(t\). Note, in the case of periodic movements, this movement stage can also be seen as the phase of the movement’s cycle. Based on Markovian assumptions, we find that $$ f_{Y_t}\left(y_t|y_1,\ldots,y_{t-1}\right) \approx f_{Y_t}\left(y_t|\hat{x}_t\right) f_{X_t}\left(\hat{x}_t|\hat{x}_{t-1}\right) \; ,$$ with \(\hat{x}_t\) an approximation of \(x_t\) that minimises \(f_{\left\{X_0,\ldots,X_t\right\}}\left(x_0,\ldots,x_t|y_1,\ldots,y_t\right)\). \(f_{Y_t}\left(y_t|x_t\right)\) is learnt from training sequences using Parzen window estimation, while \(f_{X_t}\left(x_t|x_{t-1}\right)\) is set analytically so that \(x_t\) evolves steadily during a movement. The dynamics quality is then assessed as the log-likelihood of the model describing a sequence of poses within a window of size \(\omega\): $$\mbox{llh}_{\mbox{dyn}} \approx \frac{1}{\omega} \sum_{i=t-\omega+1}^{t} \log\left( f_{Y_i}\left(y_i|x_i\right) f_{X_i}\left(x_i|x_{i-1}\right) \right)\; .$$

Two thresholds on the two likelihoods, determined empirically, are used to classify the gait being normal and abnormal. Thresholds on the derivatives of the log-likelihoods allow refining the detections of abnormalities and of returns to normal.

Results

Gait on stairs

In order to analyse the quality of gait of subjects walking up stairs, we build our model of normal movement using 17 training sequences from 6 healthy subjects having no injury or disability, from which we extract 42 gait cycles.

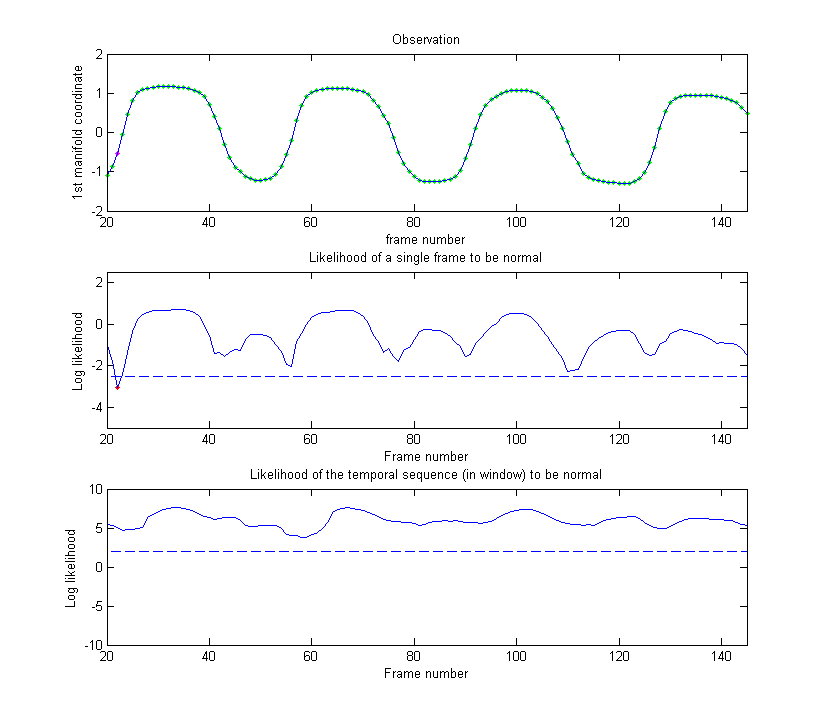
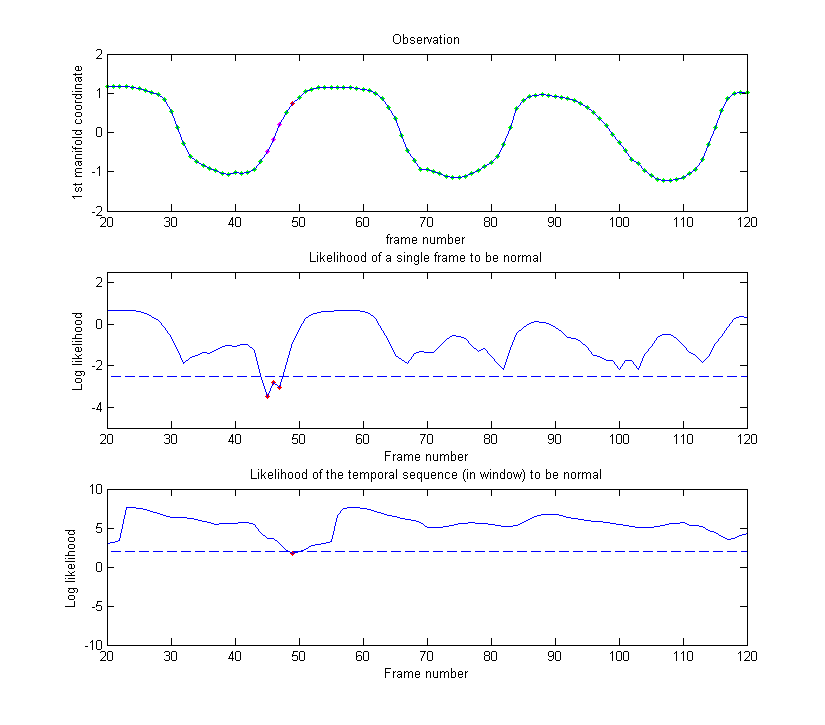
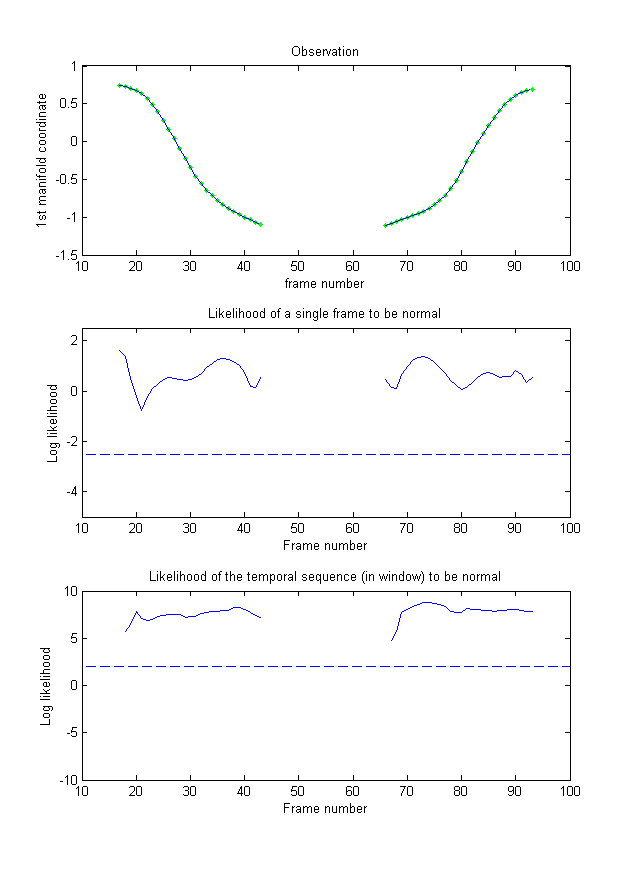
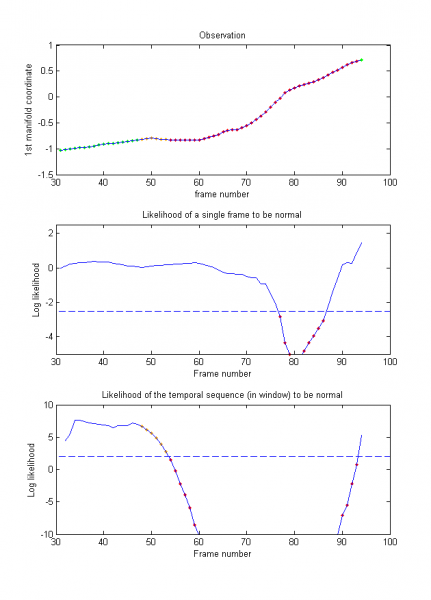
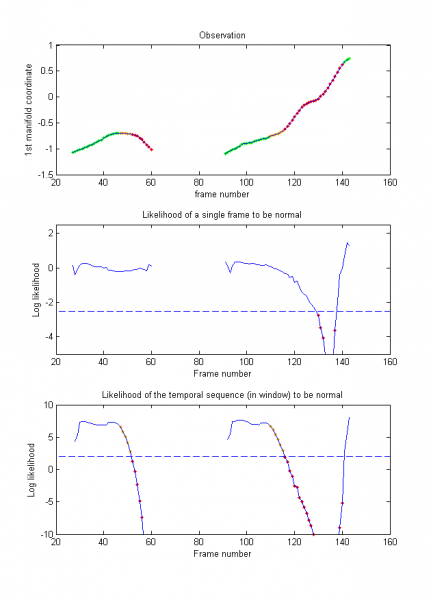
We first prove the ability of our model to generalise to the gait of new subjects by evaluating the 13 normal gait sequences of 6 new subjects. As illustrated in Figs. 3 and 4, the normal gaits of new persons are well represented by the model, with the two likelihoods (middle and bottom rows) staying above the thresholds (dotted lines). In only one sequence out of all 13 did the likelihood drop slightly under the threshold (frames 45–47 of Fig. 4) due to particularly noisy skeletons.

normal_gait_example1 normal_gait_example2
Figure 3: Example 1 of normal gait – The model of normal movement can represent well the gait of a new subject, with the two likelihoods (middle and bottom rows) staying above the thresholds (dotted lines). Green: Normal, Red: Abnormal. Figure 4: Example 2 of normal gait – In frames 45–47, a particularly noisy skeleton leads to the likelihood dropping slightly under the thresholds. As a result, this part of the gait is classified as abnormal. Green: Normal, Red: Abnormal.

Next, we apply our proposed method to three types of abnormal gaits:

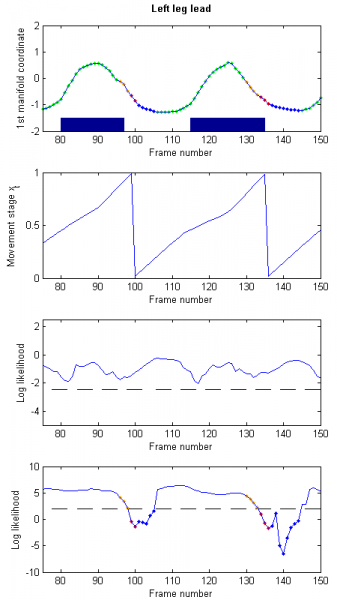
  • “Left leg Lead” (LL) abnormal gait: the subjects walk up the stairs always initially using their left leg to move to the next upper step (illustrated in Fig. 5).
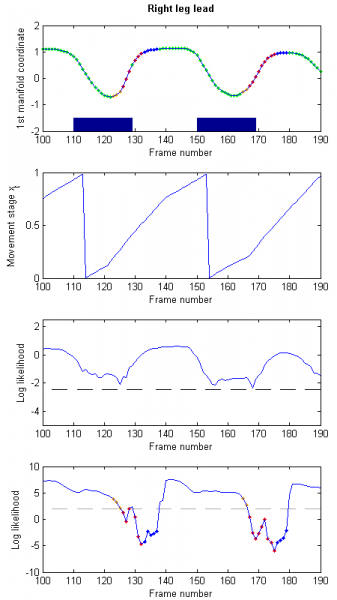
  • “Right leg Lead” (RL) abnormal gait: the subjects walk up the stairs always initially using their right leg to move to the next upper step (illustrated in Fig. 6).
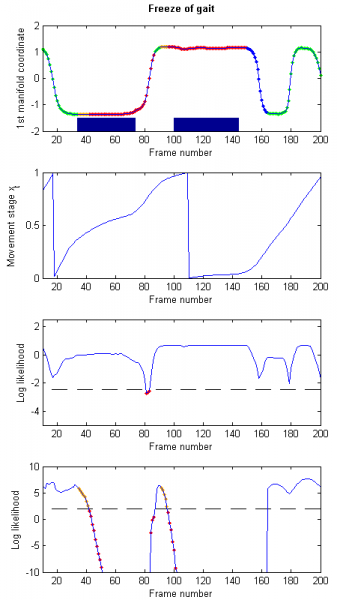
  • “Freeze of Gait” (FoG): the subjects freeze at some stage of the movement (illustrated in Fig. 7).

In all three cases, the pose of the subject is always normal, but its dynamics is affected by either the use of the unexpected leg (LL and RL) or by the (temporary) complete stop of the movement.

In our tests, these abnormal events are detected by our method with a rate of 0.93, with the likelihood dropping at all but 2 gait cycles in the LL and RL cases, and during the stops in the FoG case. Table 1 summarises the detection rates of abnormal events by our method.

abnormal_gait_example1_LL abnormal_gait_example2_RL abnormal_gait_example3_FoG
Figure 5: Example of “Left leg Lead” abnormal gait – Every time the subject uses an unexpected leg, the movement’s stage stops evolving steadily and the dynamics likelihood (bottom row) drops below its threshold (dotted line). Green: Normal, Red: Abnormal, Blue: Refined detection of normal, Orange: Refined detections of abnormal. Manual detections are presented as shaded blue areas. Figure 6: Example of “Right leg Lead” abnormal gait – Every time the subject uses an unexpected leg, the movement’s stage stops evolving steadily and the dynamics likelihood (bottom row) drops below its threshold (dotted line). Green: Normal, Red: Abnormal, Blue: Refined detection of normal, Orange: Refined detections of abnormal. Manual detections are presented as shaded blue areas. Figure 7: Example of “Freeze of gait” – The subject freezes twice during the sequence, resulting in the movement’s stage not evolving anymore at these times, and the dynamics likelihood dropping dramatically. Green: Normal, Red: Abnormal, Blue: Refined detection of normal, Orange: Refined detections of abnormal. Manual detections are presented as shaded blue areas.
Table 1: Results on detection of abnormal events
Type of event Number of occurences False Positives True Positives False Negatives Proportion missed
LL 21 0 19 2 0.10
RL 25 0 23 2 0.08
FoG 12 2 12 0 0
All 58 2 54 4 0.07

Sitting and standing

We also apply our proposed method to the analysis of sitting and standing movements. Two separate (bi-component) models are built, to represent sitting and standing movements respectively. They are executed concurrently, and their analyses are triggered when their respective starting conditions are detected. We use the very simple starting condition of the first coordinate of \(\mathbf{Y}\) staying at its starting value for a few frames, and then deviating. Our stopping condition is similar.

For our experiments, a qualified physiotherapist simulates abnormal sitting and standing movements, such as a loss of balance while standing up that leads to an exaggerated inclination of the torso, as illustrated in Figs. 9 and 10.

normal_sit_stand abnormal_stand1 abnormal_stand2
Figure 8: Example of normal sitting and standing movements – The two sitting and standing models are used iteratively and are triggered automatically when their starting conditions are detected. Figure 9: Example abnormal standing movement – The subject loses their balance and leans forward. Green: Normal, Red: Abnormal, Orange: Refined detections of abnormal. Figure 10: Example of difficult standing movement – The subject fails on their first attempt to stand up. This failure is detected and the tracking stops. It resumes on the second attempt, and detects the torso leaning forward exaggeratedly. Green: Normal, Red: Abnormal, Orange: Refined detections of abnormal.


Sport boxing

We analyse boxing movements consisting of a cross left punch (a straight punch thrown from the back hand in a southpaw stance) and a return to initial position. We use the same strategy than for sitting and standing movements, with two separate models that are triggered iteratively and automatically when their respective starting conditions are observed.

In our testing sequence, the subject alternates between 3 normal and 3 abnormal punches. Different types of abnormalities that are typical beginner mistakes are simulated for each set of 3 abnormal punches. The results, presented in Fig. 11, show that as in previous experiments, abnormal movements are correctly detected, as well as return to normality. Note that in this experiment, most abnormal movements are due to a wrong pose of the subject and therefore trigger strong responses from the pose model. The level of abnormality is also be quantified by the variations of \(\mbox{llh}_{\mbox{pose}}\) and \(\mbox{llh}_{\mbox{seq}}\) that correspond to different amplitudes of pose mistakes. For example, non-rotating hips (first 2 sets of anomalies) affect the whole body thus they trigger a stronger response than a too high punching elbow (fourth set of anomalies).

Boxing
Figure 11: Example of analysis of sport movements: cross left punch in boxing.

Publications and datasets

Our proposed method for assessing movement quality is presented in the following article:

The dataset used in this article can be downloaded in full (depth videos + skeleton) here, and a lighter version with skeleton only here. It may be used on the condition of citing our paper “Online quality assessment of human movement from skeleton data, BMVC2014” and the SPHERE project.

References

[1] OpenNI skeleton tracker. URL http://www.openni.org/documentation.

[2] R. R. Coifman and S. Lafon. Diffusion maps. Applied and computational harmonic analysis, 21(1):5–30, 2006

[3] S. Gerber, T. Tasdizen, and R. Whitaker. Robust non-linear dimensionality reduction using successive 1-dimensional Laplacian eigenmaps. In Proceedings of the 24th international conference on Machine learning, pages 281–288. ACM, 2007

Automated Driver Assistance Systems

Real Time Detection and Recognition of Road Traffic Signs

Researchers

Dr. Jack Greenhalgh and Prof. Majid Mirmehdi

Overview

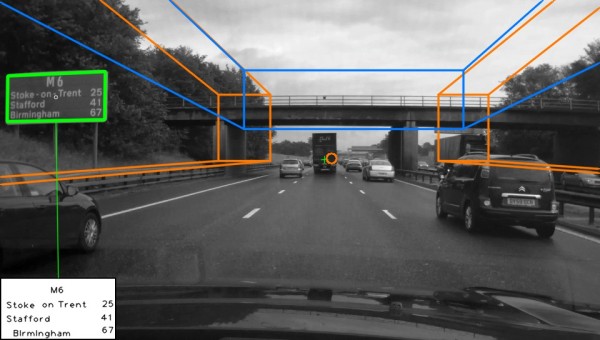
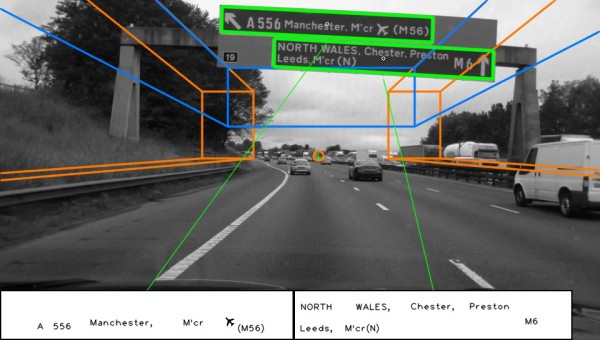
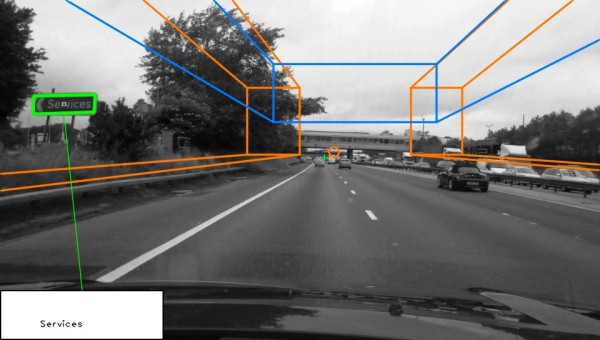
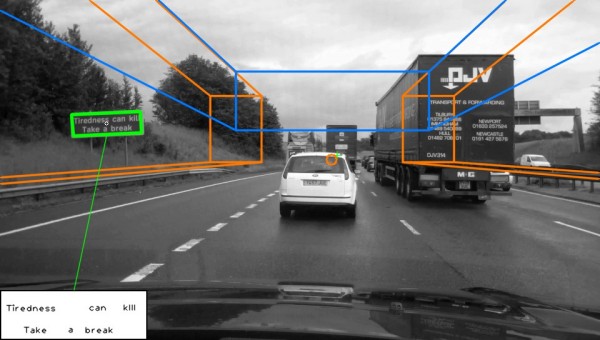
We researched automatic detection and recognition of text in traffic signs. Scene structure is used to define search regions within the image, in which traffic sign candidates are then found. Maximally stable extremal regions (MSER) and hue, saturation, value (HSV) colour thresholding are used to locate a large number of candidates, which are then reduced by applying constraints based on temporal and structural information. A recognition stage interprets the text contained within detected candidate regions. Individual text characters are detected as MSERs and grouped into lines before being interpreted using optical character recogntion (OCR). Recognition accuracy is vastly improved through the temporal fusion of text results across consecutive frames.

Publications

Jack Greenhalgh, Majid Mirmehdi, Detection and Recognition of Painted Road Markings. 4th International Conference on Pattern Recognition Applications and Methods, January 2015, Lisbon, Portugal. [pdf]

Jack Greenhalgh, Majid Mirmehdi, Recognizing Text-Based Traffic Signs. Transactions on Intelligent Transportation Systems, 16 (3), 1360-1369, 2015 [pdf]

Jack Greenhalgh, Majid Mirmehdi, Automatic Detection and Recognition of Symbols and Text on the Road Surface, Pattern Recognition: Applications and Methods, 124-140, 2015

Jack Greenhalgh, Majid Mirmehdi, Real Time Detection and Recognition of Road Traffic Signs. Transactions on Intelligent Transportation Systems, Vol.13, no.4, pp.1498-1506, Dec.2012 [pdf]

Jack Greenhalgh, Majid Mirmehdi, Traffic Sign Recognition Using MSER and Random Forests. 20th European Signal Processing Conference, pages 1935-1939. EURASIP, August 2012, Bucharest, Romania. [pdf]


Data

Here is some data for the detction and recognition of text-based road signs. This dataset consists of 9 video sequences, with a total of 23,130 frames, at a resolution of 1920 X 1088 pixels. Calibration parameters for the camera used to capture the data are also provided.

https://www.cs.bris.ac.uk/home/greenhal/textdataset.html

SPHERE – a Sensor Platform for HEalthcare in a Residential Environment

Sphere Project main objective is to develop a multimodality sensing platform, based on low-cost devices: ranging from on-body sensors, environmental sensors and video based sensors. The SPHERE platform is aiming at efficiently tackling the problem of healthcare monitoring at home. Its vision is not to develop fundamentally-new sensors for individual health conditions but rather to impact all these healthcare needs simultaneously through data-fusion and pattern-recognition from a common platform of non-medical/environmental sensors at home. The system will be general-purpose, low-cost and hence scalable. Sensors will be entirely passive, requiring no action by the user and hence suitable for all patients including the most vulnerable. A central hypothesis is that deviations from a user’s established pattern of behaviour in their own home have particular, unexploited, diagnostic value.

Computer Vision in Sphere: WP2 (Vision Team)

The main objectives of WP2 consist of developing an efficient, real-time multi-camera system for activity monitoring in the home environment. The system will be based on low cost cameras and depth sensors to estimate client’s position and to analyse their movements to extract features for use for action understanding and activity recognition.

The vision team are developing a video based action recognition and multi-user tracking system for the house environment. This solution will allow the system to estimate the activity/inactivity level of the user during their daily life. The platform has been tested in SPHERE’s house and integrated with the other sensor systems; providing a unique multisensory system for data collection. On-going video work includes a collaboration with respiratory physicians in Bristol developing and validating video-based systems for monitoring breathing.

vision

Related Projects

Online quality assessment of human movements from skeleton data
The objective of this project is to evaluate the quality of human movements from visual information. This has use in a broad range of applications, such as diagnosis and rehabilitation.

Real Time RGB-D tracker: DS-KCF 
The objective of this project is develop a real time RGB-D tracker based on Kernelised Correlation Filters

WP2 Publications

2015
  • Massimo Camplani, Sion Hannuna,  Majid Mirmehdi, Dima Damen, Adeline Paiement, Lili Tao, Tilo Burghardt. Real-time RGB-D Tracking with Depth Scaling Kernelised Correlation Filters and Occlusion Handling. British Machine Vision Conference, September 2015.
  • N. Zhu, T. Diethe, M. Camplani, L. Tao, A. Burrows, N. Twomey, D. Kaleshi, M. Mirmehdi, P. Flach, I. Craddock, Bridging eHealth and the Internet of Things: The SPHERE Project, IEEE Intelligent Systems, (to appear).
  • A Multi-modal Sensor Infrastructure for Healthcare in a Residential Environment. P. Woznowski, X. Fafoutis, T. Song, S. Hannuna, M. Camplani, L. Tao, A. Paiement, E. Mellios, M. Haghighi, N. Zhu, G. Hilton, D. Damen, T. Burghardt, M. Mirmehdi, R. Piechocki, D. Kaleshi and I. Craddock. IEEE International Conference on Communications (ICC), Workshop on ~ICT-enabled services and technologies for eHealth and Ambient Assisted Living.
2014
  • A. Paiment, L. Tao, S. Hannuna, M. Camplani, D. Damen and M. Mirmehdi, Majid (2014). Online quality assessment of human movement from skeleton data. British Machine Vision Conference (BMVC), Nottingham, UK

Object Modelling From Sparse And Misaligned 3D and 4D Data

Object modelling from 3D and 4D sparse and misaligned data has important applications in medical imaging, where visualising and characterising the shape of, e.g., an organ or tumor, is often needed to establish a diagnosis or to plan surgery. Two common issues in medical imaging are the presence of large gaps between the 2D image slices which make a dataset, and misalignments between these slices, due to patient’s movements between their respective acquisitions. These gaps and misalignments make the automatic analysis of the data particularly challenging. In particular, they require interpolation and registration in order to recover a complete shape of the object. This work focuses on the integrated registration, segmentation and interpolation of such sparse and misaligned data. We developed a framework which is flexible enough to model objects of various shapes, from data having arbitrary spatial configuration and from a variety of imaging modalities (e.g. CT-scan, MRI).

ISISD: Integrated Segmentation and Interpolation of Sparse Data

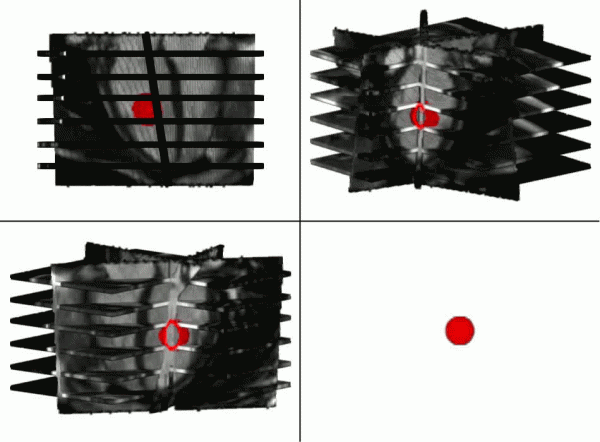
We present a new, general purpose, level set framework which can handle sparse data, by simultaneously segmenting the data and interpolating automatically its gaps. In this new framework, the level set implicit function is interpolated by Radial Basis Functions (RBFs), and its interface can propagate in a sparse volume, using data information where available, and RBF based interpolation of its speeds in the gaps. Any segmentation criteria may be used, thus allowing the framework to process any imaging modalities. Different modalities can be handled simultaneously due to the method interpolating the level set contour rather than the image intensities. This new level set framework benefits from a better robustness to noise in the images, and can segment sparse volumes by integrating the shape of the objects in the gaps.

More details and results may be found here.

The method is described in:

  • Adeline Paiement, Majid Mirmehdi, Xianghua Xie, Mark Hamilton, Integrated Segmentation and Interpolation of Sparse Data. IEEE Transactions on Image Processing, Vol. 23, Issue 1, pp. 110-125, 2014.

IReSISD: Integrated Registration, Segmentation and Interpolation of Sparse Data

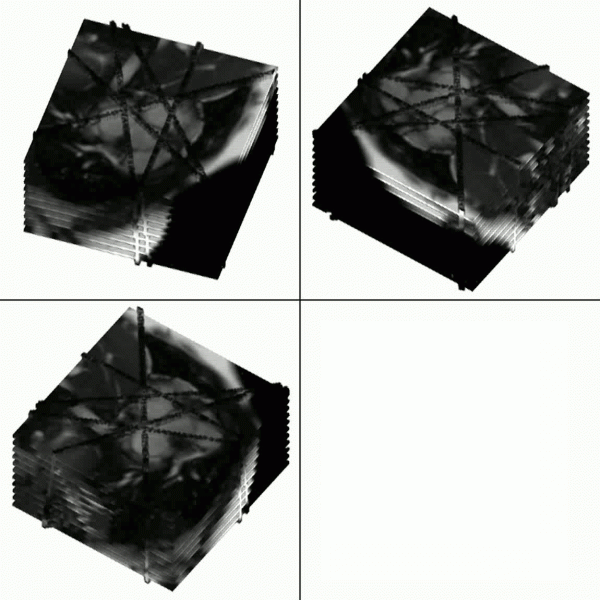
A new registration method, Registration_SA_LAalso based on level set, has been developed and integrated to the previous RBF interpolated level set framework. Thus, the new framework can correct misalignments in the data, at the same time as it segments and interpolates it. The integration of all three processes of registration, segmentation and interpolation into a same framework allows them to benefit from each others. Notably registration exploits the shape information provided by the segmentation stage, in order to be robust to local minima and to limited intersections between the images of a dataset.

More details and results may be found here.

The method is described in:

  • Adeline Paiement, Majid Mirmehdi, Xianghua Xie, Mark Hamilton, Registration and Modeling from Spaced and Misaligned Image Volumes. Submitted to IEEE Transactions on Image Processing.

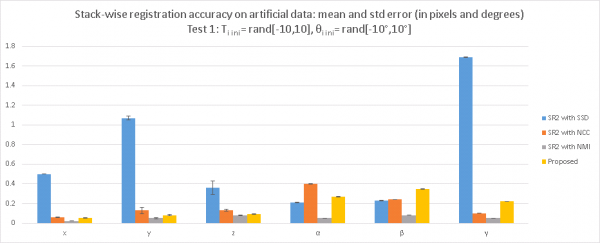
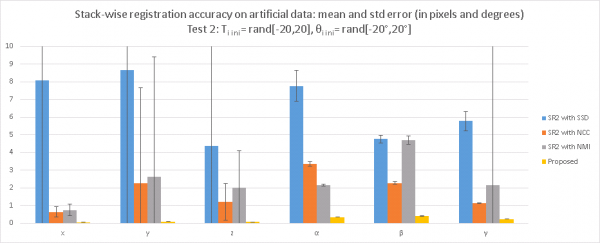
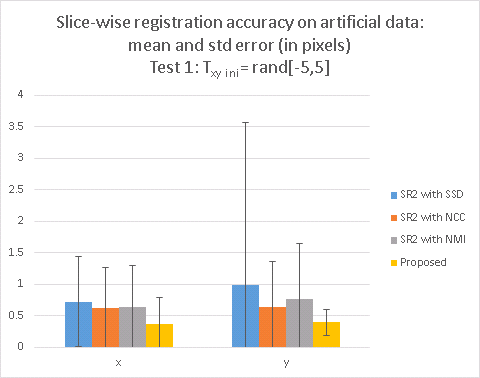
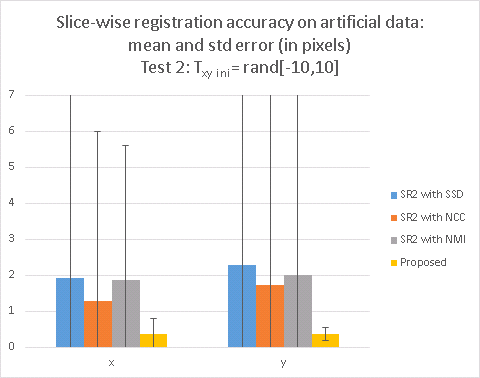
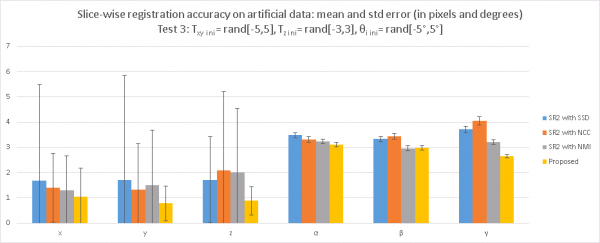
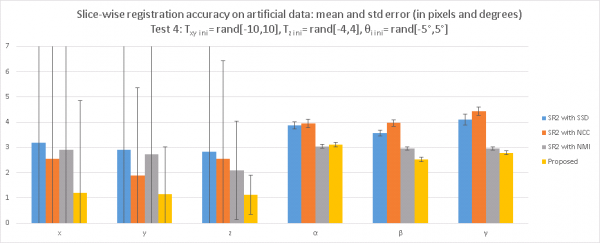
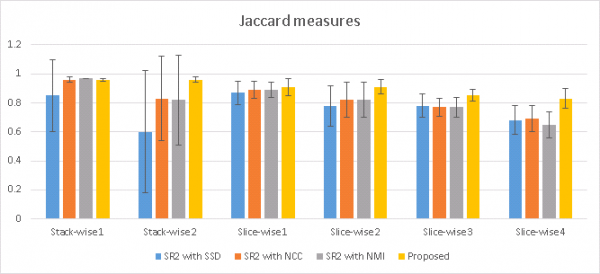
The tables in the article are reported in the graphs below:

stack1

stack2

slice1slice2

slice3

slice4

jaccard

Published Work

  1. Adeline Paiement, Majid Mirmehdi, Xianghua Xie, Mark Hamilton, Integrated Segmentation and Interpolation of Sparse DataIEEE Transactions on Image Processing, Vol. 23, Issue 1, pp. 110-125, 2014.
  2. Adeline Paiement, Majid Mirmehdi, Xianghua Xie, Mark Hamilton, Simultaneous level set interpolation and segmentation of short- and long-axis MRI. Proceedings of Medical Image Understanding and Analysis (MIUA) 2010, pp. 267–272. July 2010. – PDF, 173 Kbytes.

Download Software

The latest version of the code for ISISD and IReSISD can be downloaded here (Version 1.3).

Earlier versions: